After submission of the SMILES the following output is generated:
Figure 2. (a) The probability of the molecule to show B cell and T cell activity is predicted. The # (number) of features required for an AUC >= 0.8 gives an idea of the generalization of the model. The fewer features needed to reach a high AUC, the more likely the model’s reasoning is based on pattern recognition as opposed to memorization. Additionally, the number of known epitopes used to train the model is shown. (b) A detailed table lists the important substructure features including related statistics. For each feature, the null hypothesis was tested, that the feature count of the epitopes was selected from the same distribution as for all ChEBI structures without epitopes. The p-value can be used as a measure for substructure importance. The p-values were additional Bonferroni corrected. The additional statistics for each fingerprint include the percentage of the epitopes which have this substructure (Sample (P) %), this fraction divided by the percentage of all other molecules with this substructure (Fold), and the difference of the mean substructure count (Mean diff.). (c) For each fingerprint, a figure is generated. The count of this fingerprint in the query molecule and the 5 most similar molecules from the ChEBI are shown. (d) For each of the similar molecules the following properties are provided: the Euclidean distance (E Dist.) of all the significant fingerprints, the Tanimoto similarity, known immunogenicity of the molecule (epitope yes or no), and a link to the ChEBI entry (IDs).
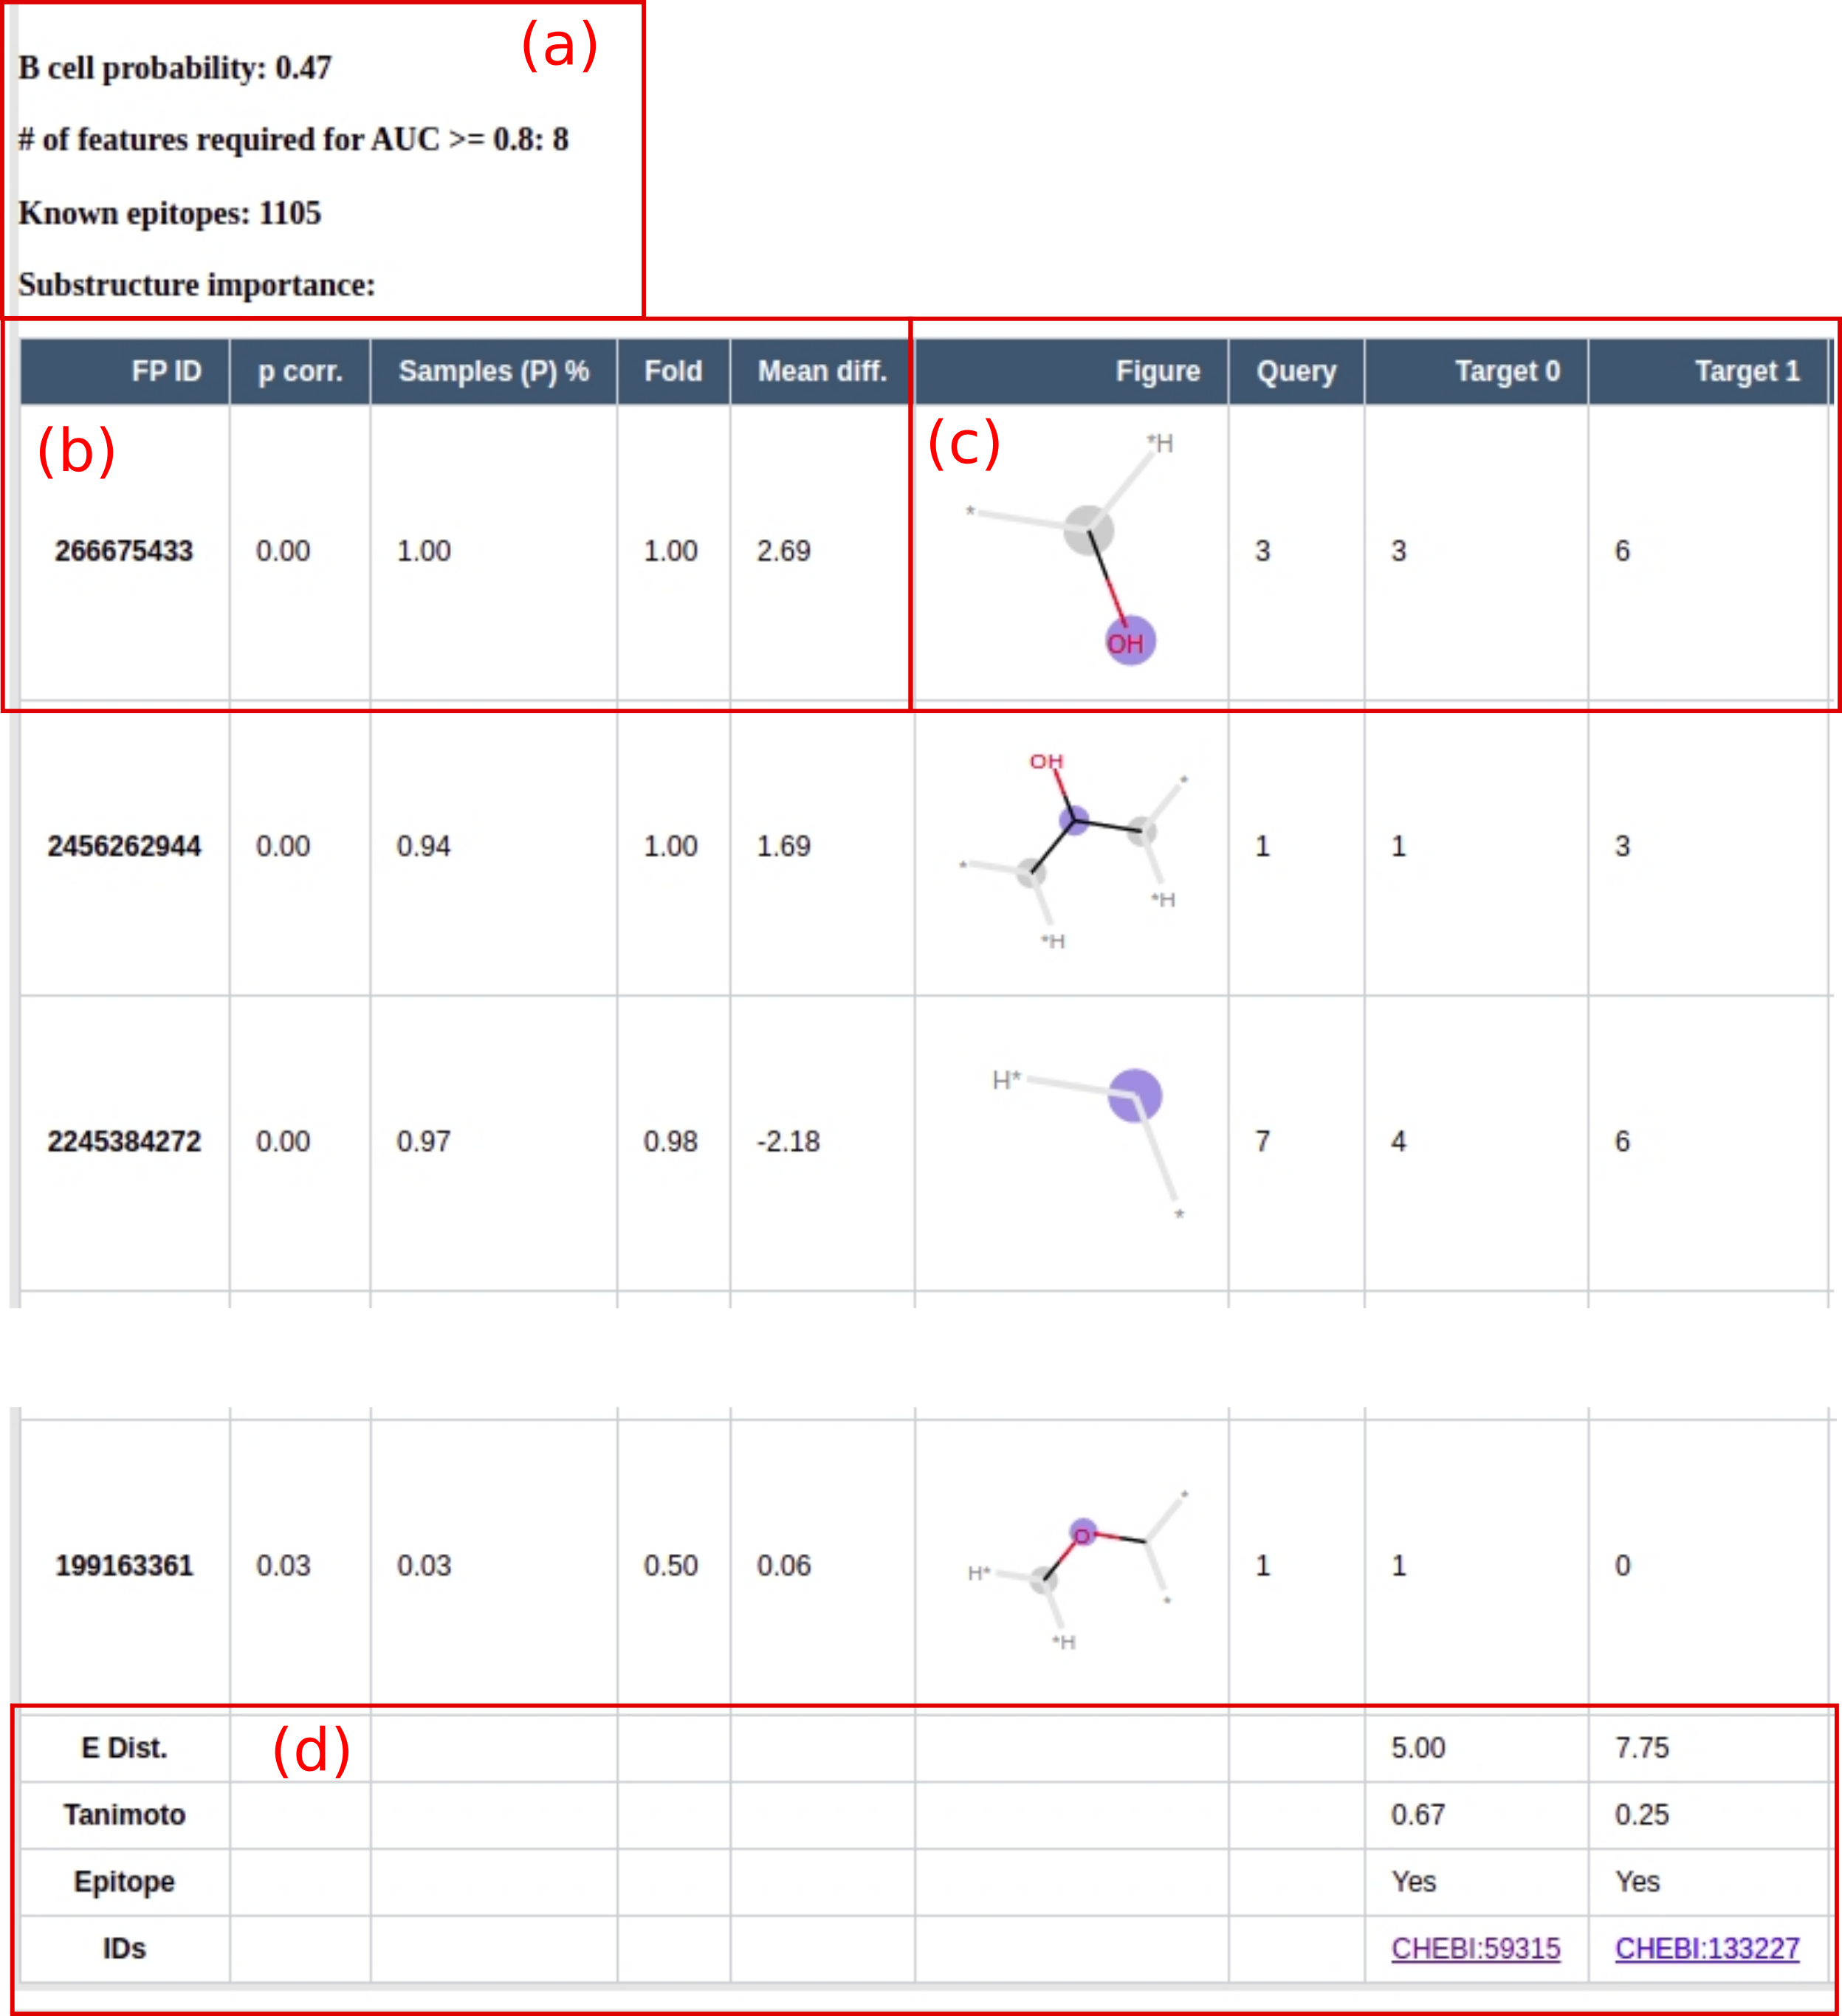
Figure 2. (a) The probability of the molecule to show B cell and T cell activity is predicted. The # (number) of features required for an AUC >= 0.8 gives an idea of the generalization of the model. The fewer features needed to reach a high AUC, the more likely the models reasoning is based on pattern recognition as opposed to memorization. Additionally, the number of known epitopes used to train the model is shown. (b) A detailed table lists the important substructure features including related statistics. For each feature the null hypothesis was tested, that the feature count of the epitopes was selected from the same distribution than for all ChEBI structures without epitopes.The p-value can be used as a measure for the substructure importance. The p-values were additional Bonferroni corrected. The additional statistics for each fingerprint include: the percentage of the epitopes which have this substructure (Sample (P) %), this fraction divided by the percentage of all other molecules with this substructure (Fold), and the difference of the mean substructure count (Mean diff.). (c) For each fingerprint a figure is generated. The count of this fingerprint in the query molecule and the 5 most similar molecules from the ChEBI are shown. (d) For each of the similar molecules the following properties are provided: the euclidean distance (E Dist.) of all the significant fingerprints, the tanimoto similarity, known immunogenicity of the molecule (epitope yes or no) and a link to the ChEBI entry (IDs).