Immunogenicity Score - Tutorial
The tool is developed to predict the allele independent CD4 T cell immunogenicity at population level. User can predict the T cell immunogenicity using 7-allele method (Paul et. al. 2015), immunogenicity method and combined method (IEDB recommended). The combined method predicts the final score that combines the predictions from 7-allele method and immunogenicity method.
In the restult, the "Immunogenicity Score" ranges from 0 to 100, with low values identifying more immunogenic peptides and high values non-immunogenic peptides.
And the "Combined Score" is given by combining both HLA binding and the immunogenicity prediction which presumably incorporate the capacity of being recognized by TCR. And low value identifying high capacity of being recognized by TCR.
The Combined Score and Median Percentile rank values of the 7-allele method that were obtained before September 4th, 2019 may differ from the current output, as NetMHCIIpan and NetMHCII have been updated.
The Combined Score and Median Percentile rank values of the 7-allele method that were obtained before September 4th, 2019 may differ from the current output, as NetMHCIIpan and NetMHCII have been updated.
How to use the tool
User need to specify following parameters to make predictions:
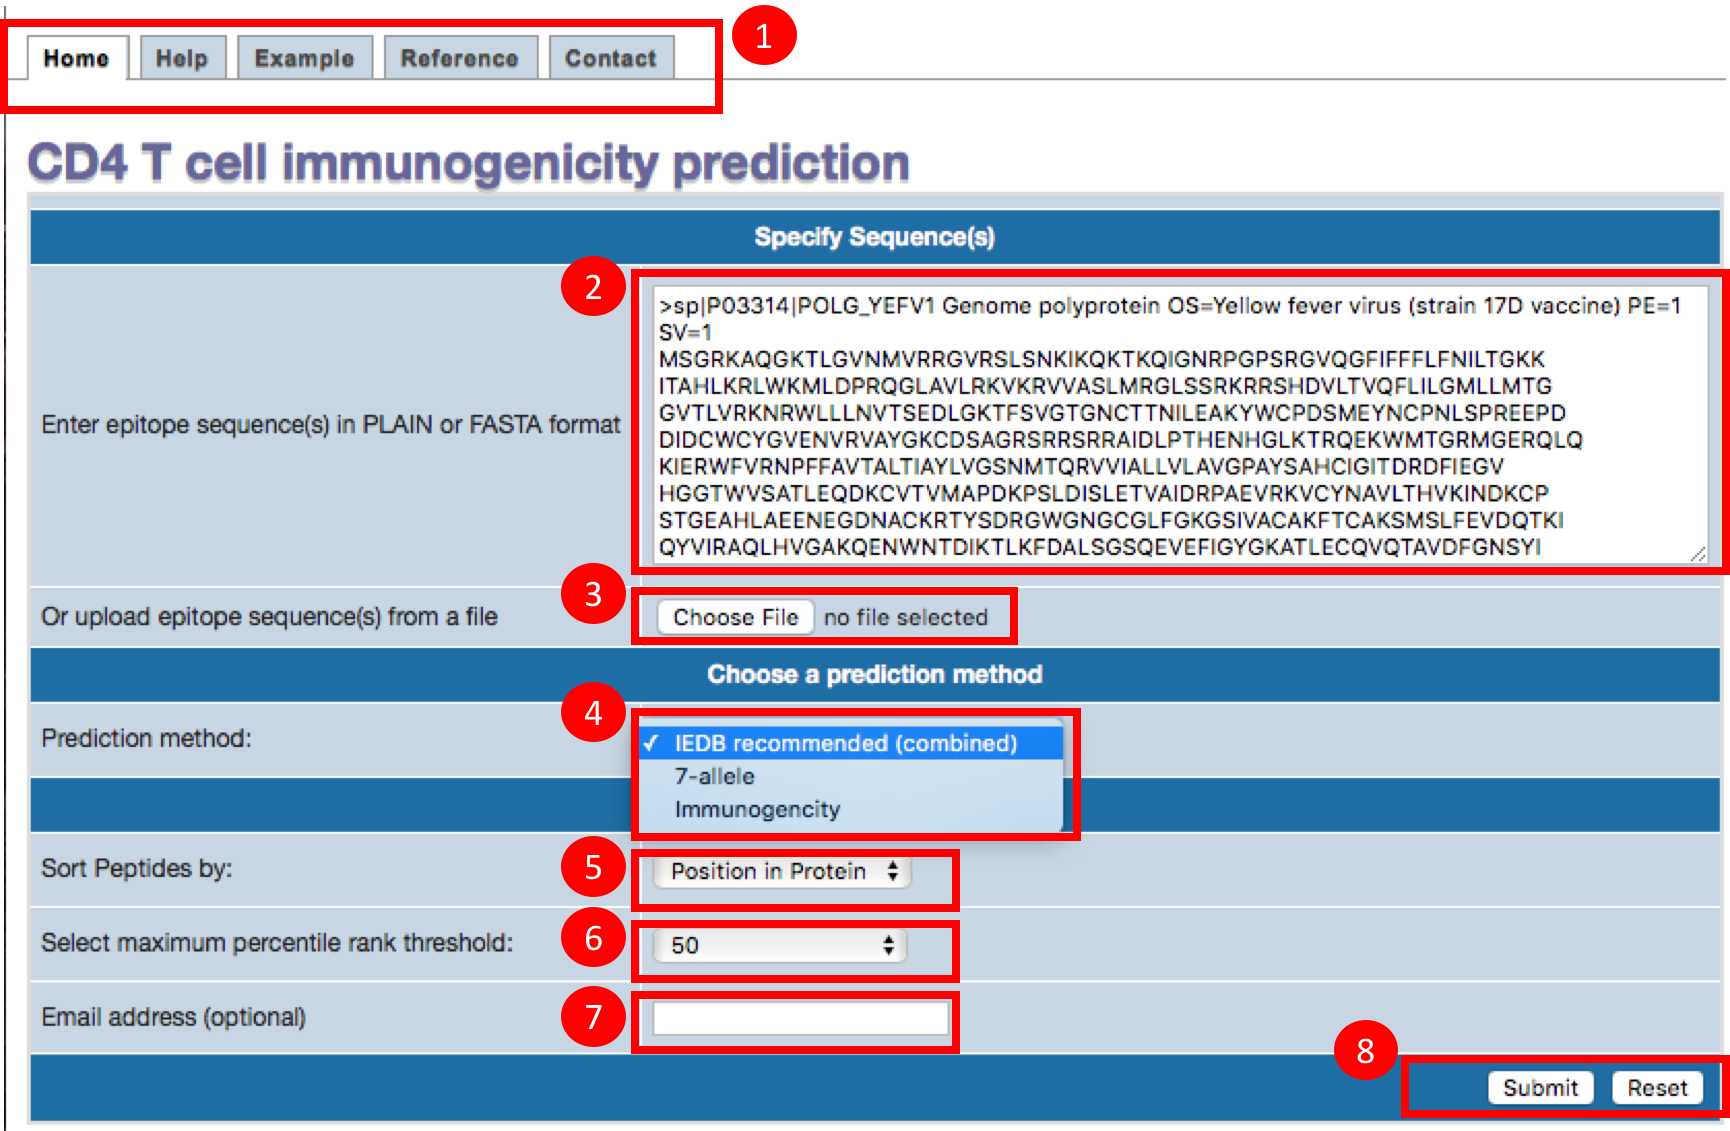
1. About the tabs on the tool
A. Home page: The first tab is for home page, which will have form submission section, where user can provide the antigen sequence and set different parameters.
B. Help page: The current page will open in help tab. This page contains the brief tutorial of the tool.
C. Example page: The page contains a few example sequences. User can select one of the sequence and then click on the submit button. It will automatically fill the given example sequence to the home page.
D. Reference page: This page contains the information of references and citations.
E. Contact page: If you need more help, please write to us usign this page.
2. Paste or type antigen sequences
Epitope sequences can be either directly entered in the text area or uploaded from a file. To upload data from a file, click the "Browse" button
to select a file. File content will then be shown in the text area. Two acceptable sequence formats are PLAIN and FASTA. A sequence in PLAIN format
is separated by a new line. A sequence in FASTA format begins with a
single-line description, followed by line(s) of sequence data. The description line is distinguished from the sequence data by a greater-than
(">") symbol in the first column.
3. Upload sequences
Alternatively, user can also upload the antigen sequences in a text file using the upload button.
4. Choose prediction method
User can choose one of the three methods for prediciting immunogenicity:
1. Immunogenicity method: The model here is trained on the T cell reactivity data.
2. 7-allele method : The model is based on MHC binding to 7-alleles, as published by Sinu et. al. 2015 .
3. Combined method (IEDB Recommended) : This method combines the predictions from MHC binding (using 7-allele method) and immunogenicity method. We found that the combined approach performed better than any of the above approaches individually.
5. Choose Sorting function
Here, you can choose, how your result table to be sorted? You can choose to sort your results based on either the position in the protein or the percentile rank
.
.
6. Choose threshold
Percentile Rank threshold: Select the maximum threshold for percentile rank
7. Email address
The prediction may take some time depending upon the number of antigen sequence provided, please provide email address in order to get your results to your email.
8. Submit or Reset
After setting all the parameters, please click the submit button to make predictions. You can reset the parameters by clicking reset button.
How the results are presented
1. Summary of the input parameters
The first section in the results will provide a summary of the input parameters, like number of input sequences, number of 15mers, threshold and the prediction method selected.
2. Download and citations
The predictions can be saved to a file by clicking on the "Download data to file" button.
How to cite the tool?
Please click on the "citation" to get the information.
Please click on the "citation" to get the information.
3. Example result table view
The results will be provided in the tabular format and the table is sorted based on the 'sorting function' selected by the user at the home page.
The final result table will be having differnt columns according to method selected. Immunogenicity method will result in the table with following columns:
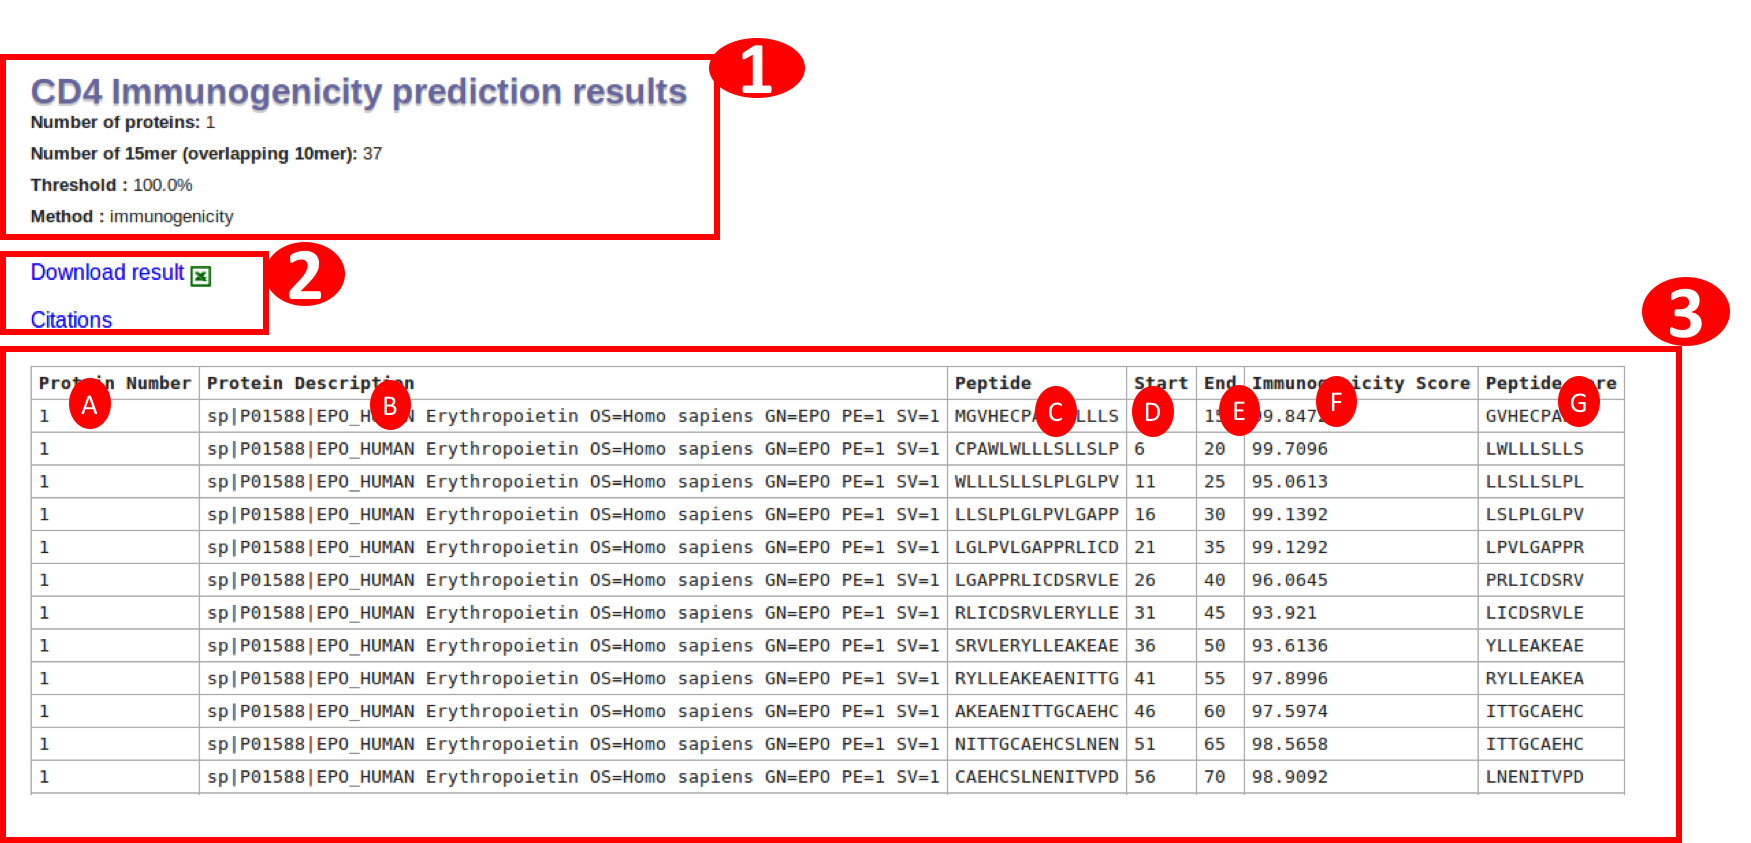
A. Protein number: is the serial number of a protein in given input.
B. Protein Description: is the description of the protien extracted from fasta header. In case of PLAIN input sequence, it will be just the sequence number.
C. Peptide : will be having the sequence of a 15mer in the protein
D. Start : will be start position of the peptide in that protein
E. End : will be end position of the peptide in that protein
F. Immunogenicity score: The second last column is the predicted immunogencity score.
G. Peptide Core: The 9amino acid peptide core used by immunogenicity Neural network model
The link for downlaod is given at the start and end of the table.
Seven allele method will result in the table with following columns:
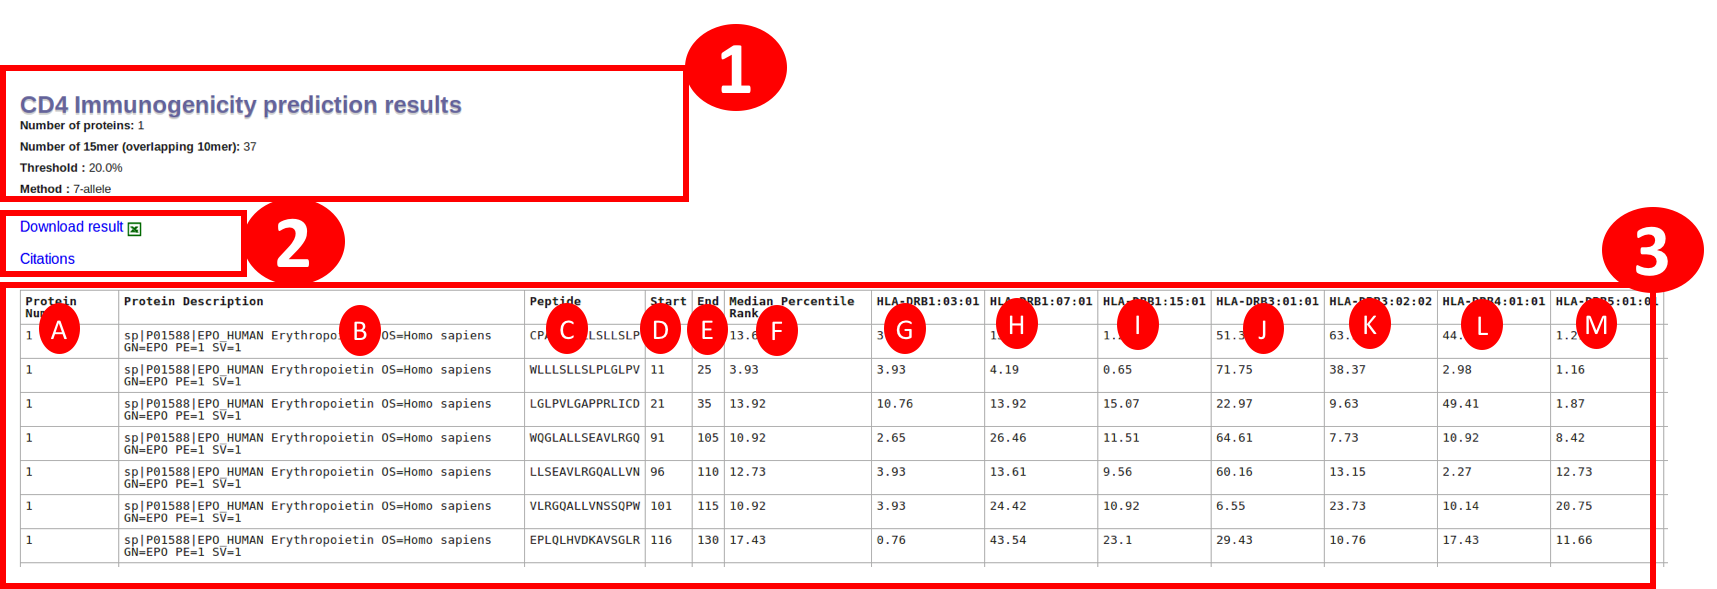
A. Protein number: is the serial number of a protein in given input.
B. Protein Description: is the description of the protien extracted from fasta header. In case of PLAIN input sequence, it will be just the sequence number.
C. Peptide : will be having the sequence of a 15mer in the protein
D. Start : will be start position of the peptide in that protein
E. End : will be end position of the peptide in that protein
F. Median Percentile rank: This column is the median percentile rank of seven alleles and the individual percentile rank is shown in following colummns
G-M. Seven alleles : The individual percentile rank of the seven alleles
The link for downlaod is given at the start and end of the table.
IEDB recommended (combined) method will result in the table with following columns:
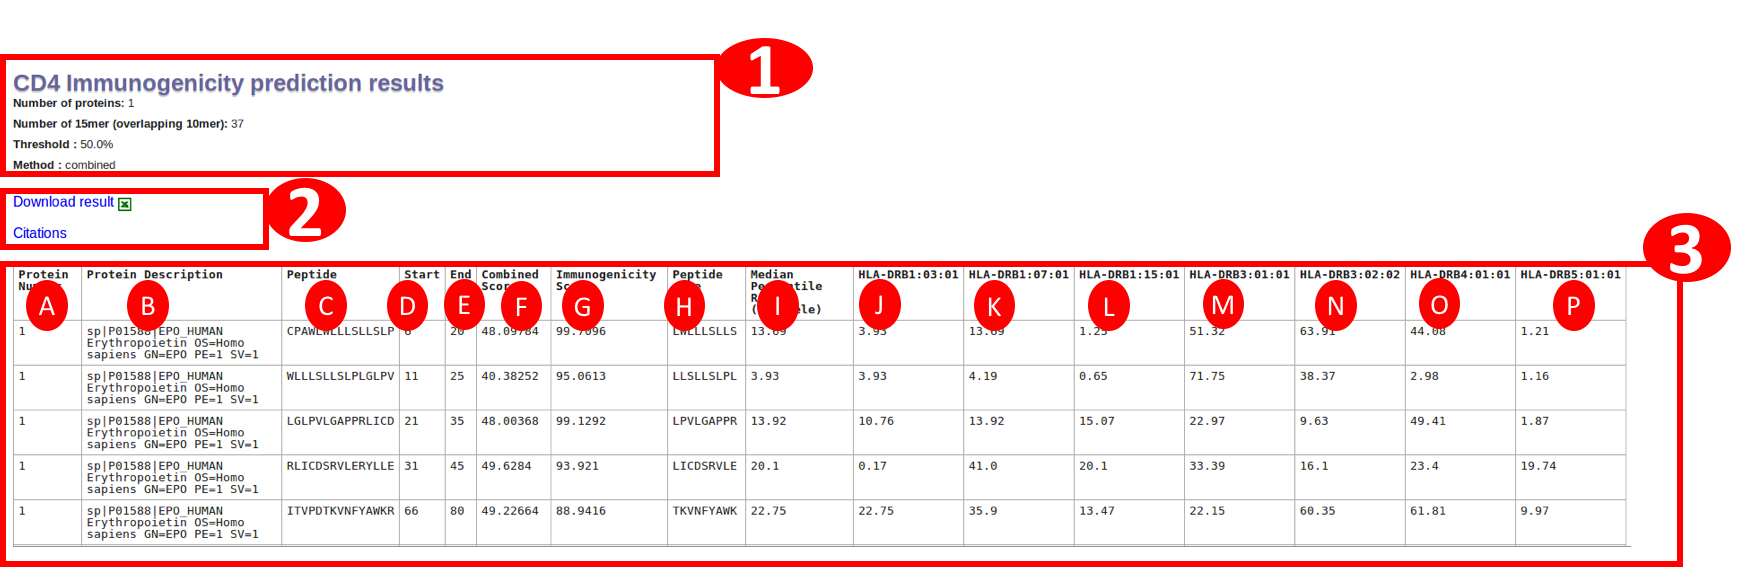
A. Protein number: is the serial number of a protein in given input.
B. Protein Description: is the description of the protien extracted from fasta header. In case of PLAIN input sequence, it will be just the sequence number.
C. Peptide : will be having the sequence of a 15mer in the protein
D. Start : will be start position of the peptide in that protein
E. End : will be end position of the peptide in that protein
F. Combined Score: This column is the combined score from median percentile rank of seven alleles and immunogenicity score using followig equation
Combined percentile rank = (alpha * Immunogenicity model score) + ((1 - alpha) * Median Percentile rank of seven alleles)
where alpha is optimized to 0.4, Please see the publication for details on alpha optimization and combined method at following link : Dhanda et al. 2018
G. Immunogenicity score: The column lists the predicted immunogencity score.
H. Peptide Core: The 9amino acid peptide core used by immunogenicity Neural network model
I. Median Percentile rank: This column is the median percentile rank of seven alleles and the individual percentile rank is shown in following colummns
J-P. Seven alleles : The individual percentile rank of the seven alleles
The link for downlaod is given at the start and end of the table.
The final result table will be having differnt columns according to method selected. Immunogenicity method will result in the table with following columns:
A. Protein number: is the serial number of a protein in given input.
B. Protein Description: is the description of the protien extracted from fasta header. In case of PLAIN input sequence, it will be just the sequence number.
C. Peptide : will be having the sequence of a 15mer in the protein
D. Start : will be start position of the peptide in that protein
E. End : will be end position of the peptide in that protein
F. Immunogenicity score: The second last column is the predicted immunogencity score.
G. Peptide Core: The 9amino acid peptide core used by immunogenicity Neural network model
The link for downlaod is given at the start and end of the table.
Seven allele method will result in the table with following columns:
A. Protein number: is the serial number of a protein in given input.
B. Protein Description: is the description of the protien extracted from fasta header. In case of PLAIN input sequence, it will be just the sequence number.
C. Peptide : will be having the sequence of a 15mer in the protein
D. Start : will be start position of the peptide in that protein
E. End : will be end position of the peptide in that protein
F. Median Percentile rank: This column is the median percentile rank of seven alleles and the individual percentile rank is shown in following colummns
G-M. Seven alleles : The individual percentile rank of the seven alleles
The link for downlaod is given at the start and end of the table.
IEDB recommended (combined) method will result in the table with following columns:
A. Protein number: is the serial number of a protein in given input.
B. Protein Description: is the description of the protien extracted from fasta header. In case of PLAIN input sequence, it will be just the sequence number.
C. Peptide : will be having the sequence of a 15mer in the protein
D. Start : will be start position of the peptide in that protein
E. End : will be end position of the peptide in that protein
F. Combined Score: This column is the combined score from median percentile rank of seven alleles and immunogenicity score using followig equation
Combined percentile rank = (alpha * Immunogenicity model score) + ((1 - alpha) * Median Percentile rank of seven alleles)
where alpha is optimized to 0.4, Please see the publication for details on alpha optimization and combined method at following link : Dhanda et al. 2018
G. Immunogenicity score: The column lists the predicted immunogencity score.
H. Peptide Core: The 9amino acid peptide core used by immunogenicity Neural network model
I. Median Percentile rank: This column is the median percentile rank of seven alleles and the individual percentile rank is shown in following colummns
J-P. Seven alleles : The individual percentile rank of the seven alleles
The link for downlaod is given at the start and end of the table.